
An Analytical Profile of Oral-Turinabol ( Dehydrochlormethyltestosterone)

Since many members are interested in analysis of anabolic androgenic steroids (AAS) we post the analytical data of dehydrochlormethyltestosterone ((17β)-4-chloro-17-hydroxy-17-methylandrosta-1,4-dien-3-one) on the most discussion-boards known as Oral Turinabol – Oral T or abbrivated as OT.
You’ll find in this blog-post also the graphics from the different analytical methods of identification (GC, GC/MS, FTIR, HPLC, 1H- and 13C- NMR).
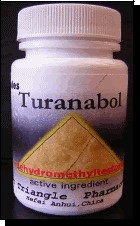 Photo 1
An analysis of a few bottles, each labelled “Turanabol,” “Chlordehydromethyltestosterone,” and “Golden Triangle Pharmaceuticals” (see Photo 1). Despite identical appearances (same bottle type, labeling, lot number, and number of tablets (100)), some of the bottles contained nondescript orange capsules while other bottles contained nondescript yellow capsules (see Photo 2). Subsequent analyses confirmed that the orange capsules contained dehydrochlormethyltestosterone as the only active ingredient, while the yellow capsules contained primarily dehydrochlormethyltestosterone with minor amounts of stanozolol and methandrostenolone (see structures, below).
Dehydrochlormethyltestosterone is a Schedule III controlled substance in the United States and is also listed in the 2006 Prohibited List/World Anti-Doping Code. It gained notoriety as a result of the East German Olympic doping scandals that were fully exposed after the fall of the Berlin wall (2 ). Data from East German medical personnel involved in the doping indicated that dehydrochlormethyltestosterone produced dramatic increases in speed and strength, but with detrimental side effects such as deepening of the voice, increased acne, and body hair growth. Other, long term side-effects ranged from liver damage to severe gynaecological disorders (2). This steroid is no longer legitimately produced, and appears to be available only as an illicitly-prepared product on the black market.
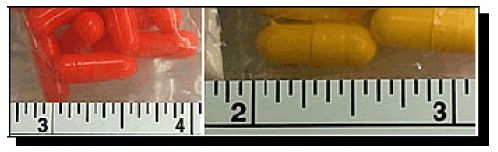
Photo 2 (Note that Both Types of Capsules are the Same Size)
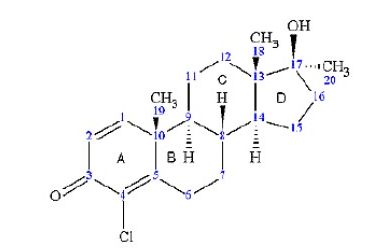
Dehydrochlormethyltestosterone (with Labeling of Rings (A-D)
and IUPAC Numbering of Carbons).
As with nearly all anabolic steroids, dehydrochlormethyltestosterone has multiple name variations, including (but not limited to): Dehydrochloromethyltestosterone, chlordehydromethyltestosterone, chlorodehydromethyltestosterone, 4-chlorodehydromethyltestosterone, 4-chloromethandienone, 4-chlor-1-dehydro-17α-methyl-testosterone, 1,4-androstadien-4-chloro-17α-methyl-17β-ol-3-one, and 4-chloro-17β-hydroxy-17α-methylandrost-1,4-dien-3-one. The most common trade name for dehydrochlormethyltestosterone, Oral-Turinabol®, is often abbreviated as “OT” in both the scientific literature and on internet websites dedicated to anabolic steroid use/abuse (2,3).
.jpg)
Not surprisingly, most of the scientific literature dedicated to the analysis of dehydrochlormethyltestosterone has a toxicological focus (that is, analysis of biological fluids for dehydrochlormethyltestosterone metabolites for detection of doping (4,5). Although there are a number of reports of submissions of dehydrochlormethyltestosterone to forensic and crime laboratories 6), complete forensic analysis of dehydrochlormethyltestosterone has not been previously reported, and even standard reference texts in the field (e.g.,7,8,9) do not contain data for this compound. Herein, we report analytical data (GC, GC/MS, FTIR-ATR, HPLC, and 1H- and 13C- NMR) for the analysis and identification of the title steroid. In addition, because this is the first comprehensive report for this steroid, an in-depth analysis of the NMR data is presented.
Standard: A reference standard of dehydrochlormethyltestosterone was obtained from Steraloids (Newport, RI).
Fourier Transform Infrared Spectrometer - Attenuated Total Reflectance (FTIR-ATR): Infrared spectroscopy was performed using a Thermo Nicolet Nexus 670 Fourier Transform Infrared Spectrometer (FTIR) (Madison, WI) equipped with a Golden Gate Attenuated Total Reflectance (ATR) detector. The sample was prepared by extraction of the capsule matrix with methanol followed by evaporation. The IR spectrum was collected by averaging 24 scans with a resolution of 4.0 wavenumbers (cm-1).
.jpg) Table 1. GC Relative Retention Times.
Table 1. GC Relative Retention Times.
High Performance Liquid Chromatography (HPLC): HPLC was conducted using an Agilent 1100 Series instrument (Waldbronn, Germany) using ultraviolet (UV) detection. The sample was dissolved in methanol and injected into the instrument using the parameters below(10).
Gas Chromatography (GC): GC screening was conducted using an Agilent 6890N (Waldbronn, Germany) equipped with flame ionization detector (FID). The sample was dissolved in methanol and injected into the instrument using the parameters below.
The chromatogram is not shown. Methandrostenolone, dehydrochlormethyltestosterone, and stanozolol eluted at 7.96, 9.32, and 10.29 minutes, respectively. The peak shape for stanozolol was broad in comparison to the other steroids. The mixture in the yellow tablets was not formally quantitated, but was estimated as roughly 100 : 5 : 2.5 dehydrochlormethyltestosterone : methandrostenolone : stanozolol. Table 1 lists the relative retention times for cocaine, heroin, and six other steroids with similar chromatography.
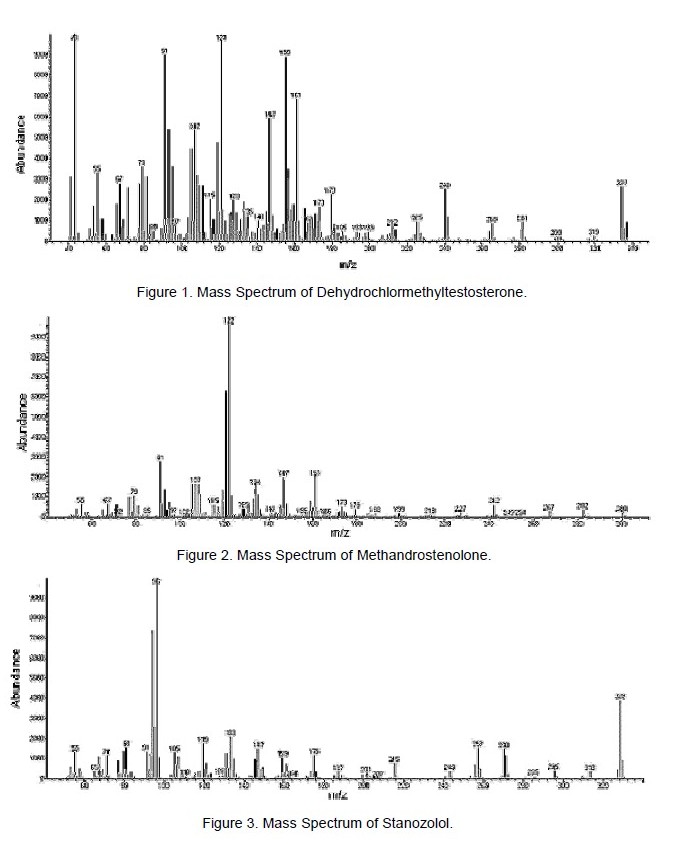
Gas Chromatography/Mass Spectrometry (GC/MS): An Agilent 6890N gas chromatograph equipped with an Agilent 5973 Mass Selection Detector (MSD) (Waldbronn, Germany) was used in the electron ionization (EI) mode to obtain mass spectra of samples and standards. Instrumental parameters are listed below. Agilent’s MS Interpreter (Version 0.9) was used to derive the relative abundances of the molecular ion cluster.
The mass spectra of dehydrochlormethyltestosterone, methandrostenolone, and stanozolol are shown in Figures 1 – 3, respectively. Dehydrochlormethyltestosterone displayed a molecular ion at m/z 334. Analysis of the molecular ion cluster (i.e., for C20H27O2Cl) revealed close agreement with the theoretical values obtained from the MS Interpreter program, confirming the molecular formula and the presence of a chlorine atom (Table 2). Of note, the spectra did not give a satisfactory match with any compound in the instrument’s database, indicating both that the compound is not a different steroid and that dehydrochlormethyltestosterone is not entered.
Table 2. Theoretical versus Actual Values for the Relative Abundances
for the Molecular Ion Cluster (i.e., for C20H27O2Cl).
Fourier Transform Infrared Spectrometer - Attenuated Total Reflectance (FTIR-ATR): The IR spectrum of the reference standard is shown in Figure 4. The spectrum displayed major absorbances for O-H (3485 cm-1), C-H (2947 cm-1) and C=O (1655 cm-1). Comparison of the reference standard with the sample is shown in Figure 5 . The direct comparison did not show a high quality match; it is suspected that either polymorphism or the presence of other soluble capsule materials in the extract caused the differences in the spectra. Again, neither spectrum gave a satisfactory match with any compound in the instrument’s database, indicating both that the compound is not a different steroid and that dehydrochlormethyltestosterone is not entered.
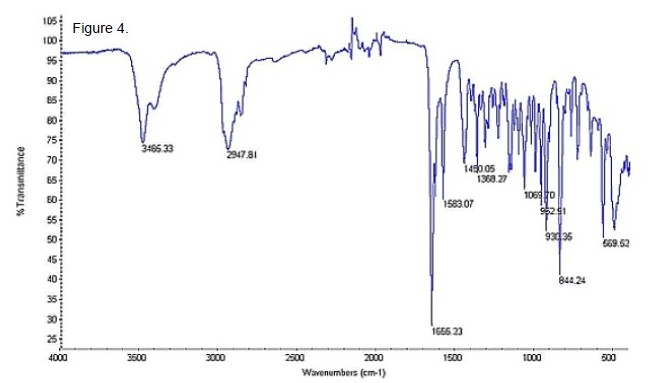
Figure 4. The Infrared Spectrum (FTIR-ATR) of Dehydrochlormethyltestosterone Reference Standard.
Figure 5. Infrared Spectrum (FTIR-ATR) of Sample of Orange Colored Capsule’s Methanol SolubleMaterials (Upper Trace) Compared to the Reference Standard (Lower Trace).
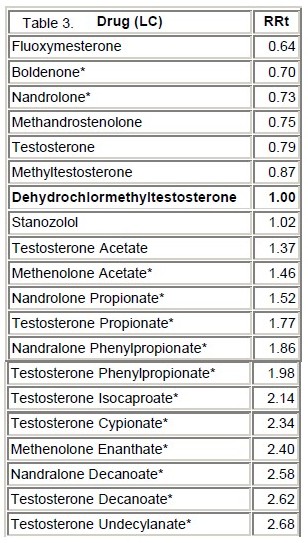 High Performance Liquid Chromatography (HPLC): The chromatograms for dehydrochlormethyltestosterone standard and a mixture of dehydrochlormethyltestosterone and stanozolol standards (roughly 5 : 95) are shown in Figure 6. The two peaks resulting from the dehydrochlormethyltestosterone - stanozolol mixture did not resolve using this method (inset in Figure 6). However, they are resolved by GC or GC/MS, enabling each to be identified. Table 3 lists the relative retention times of a series of similarly sized steroids. Figure 7 shows the UV spectrum of dehydrochlormethyltestosterone.
Table 3. HPLC Relative Retention Times (Asterisks denote steroids analyzed at an earlier date;
the retention times were adjusted relative to the dehydrochlormethyltestosterone).
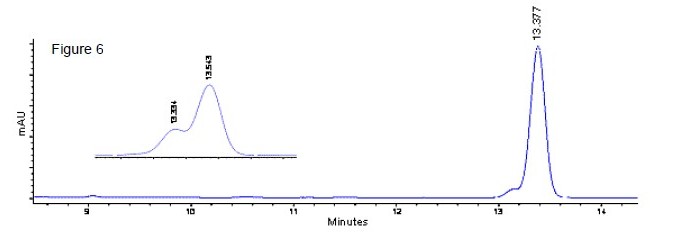
Figure 6. The HPLC UV Chromatogram (225 nm Detection) for DehydrochlormethyltestosteroneStandard (13.377 Minutes). The Inset Shows the Chromatogram for the 5 : 95 Mixture ofDehydrochlormethyltestosterone (13.334 minutes) and Stanozolol (13.543 minutes) Standards.
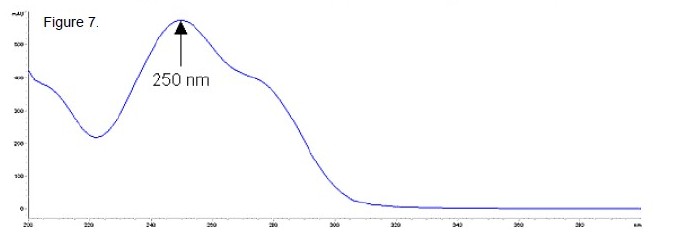
Figure 7. HPLC UV Spectrum of Dehydrochlormethyltestosterone in Methanol.
Nuclear Magnetic Resonance (NMR) Spectroscopy: The 1H-NMR spectrum of the reference standard are shown in Figures 8a – b. Spectral assignments are summarized in Table 4 (underneath). The proton, carbon, and HSQC experiments showed that the unknown molecule contained 20 carbons and 26 non-exchangeable hydrogens. There were 6 quaternary, 5 methine, 6 methylene, and 3 methyl carbons. Adding the carbons (20), non-labile protons (26), oxygens (2), and chlorine (1 based on the MS data), gives a molecular weight of 333 Daltons. The remaining mass (1 Dalton) is due to an exchangeable proton. Using the HMBC NMR data, it was determined that there is one carbonyl carbon (180 ppm), 1 - 3 bonds from 4 alkene carbons at 126.5, 128.6, 158.9, and 166.1 ppm, two of which are protonated, with the hydrogens (6.32 and 7.33 ppm) coupled to each other (J = 10.1 Hz). This corresponds well to a doubly conjugated ketone on ring “A” with the carbonyl at position 3, protonated alkene carbons at positions 1 and 2, and quaternary alkene carbons at positions 4 and 5 (meaning position 4 has a substituent, presumably the chlorine). Far removed is a quaternary carbon at 82.0 ppm, indicating that it is bonded to oxygen (likely bonded to the exchangeable proton). Assuming that this is a common steroid ring structure, placement of the carbon (82 ppm) bonded to oxygen would be at the 17 position. This accounts for all but the methyl group, and since the 82 ppm carbon is a quaternary carbon, the methyl group is attached at the 17 position. Comparison of the experimental data with that predicted with the ACD software showed very good agreement. In addition, comparison of the 1H-NMR spectrum of the unknown to methandrostenolone showed they were nearly identical below 2.0 ppm, indicating that the B, C, and D rings are the same.
Table 4. NMR Data and Assignments.
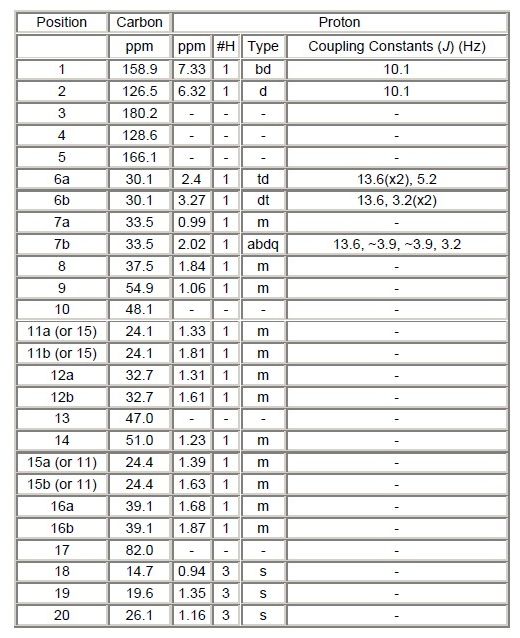
b = Broad, d = Doublet, m = Multiplet, abdq = Broad Doublet of Quartets, s = Singlet, and t = Triplet.
Final confirmation of the compound’s identity was achieved via comparison of mass spectral fragmentation patterns, GC retention times, and proton and carbon NMR spectra, with the reference standard.
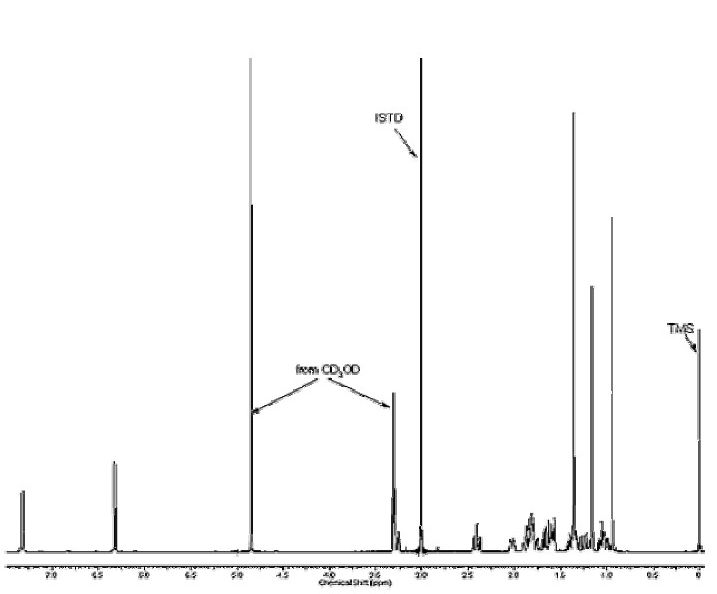
Figure 8a. 1H-NMR of Dehydrochlormethyltestosterone Reference Standard in CD3OD.Dimethylsulfone (Listed as ISTD) was used to Quantitate the Standard.
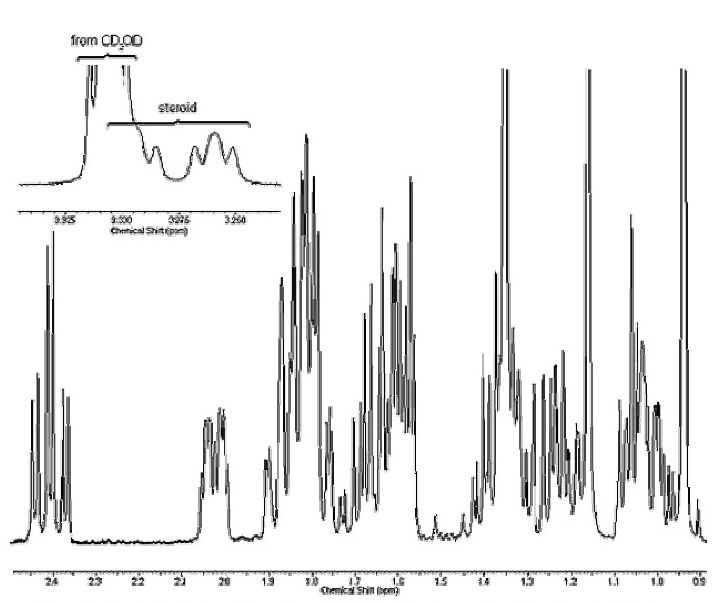
Figure 8b. Alkyl Region of Proton Spectrum of Figure 8a, Expanded to Show Peak Splitting Patterns.
- - - - - - - - - -
References
1. According to
2. Franke WW, Berendonk B. Hormonal doping and androgenization of athletes: A secret program of the German Democratic Republic government. Clinical Chemistry 1997;43(7):1262.
3. Internet searches for dehydrochlormethyltestosterone, chlordehydromethyltestosterone, Turanabol, and/or Oral-Turinabol return a multitude of websites selling or providing advice for use/abuse of this steroid.
4. Segura J. Sports. In Drug Abuse Handbook, S.B. Karch, Ed., CRC Press LLC, Boca Raton:1998, pp. 641-726 (see also Bono JP. Criminalistics - Introduction to controlled substances, pp. 1-75).
5. Leinonen A. Novel mass spectrometric analysis for anabolic androgenic steroids in sports drug testing. (Dissertation) Helsinki University Printing House, Helsinki:2006 (see: //ethesis.helsinki.fi/julkaisut/far/farma/vk/leinonen/novelmas.pdf).
6. Smith PR (Special Testing and Research Laboratory), personal communication, 2007 (based on reports made to the Clandestine Laboratory Investigating Chemists Association Bulletin Board).
7. Galichet LY, Moffat AC, Osselton MD, Widdop, B. Clarke’s Analysis of Drugs and Poisons, 3rd ed., Galichet, Moffat, Osselton and Widdop, Eds., Pharmaceutical Press, Grayslake, IL:2004.
8. Pfleger K, Maurer HH, Weber A. Mass Spectral and GC Data, 2nd ed., VCH, New York, NY:1992.
9. Mills III T, Roberson JC. Instrumental Data for Drug Analysis, 2nd ed., Elsevier, New York, NY:1987 (also subsequent editions and supplements)
- Login to post comments